


Essential Questions:
- What is the cost of industrialization and who pays it?
- How do we determine whether food is safe?
- How do you balance food security (production) and food safety?
Warm-up:
1. What is your favorite meal that involves rice? Describe it. (pair or class discussion)
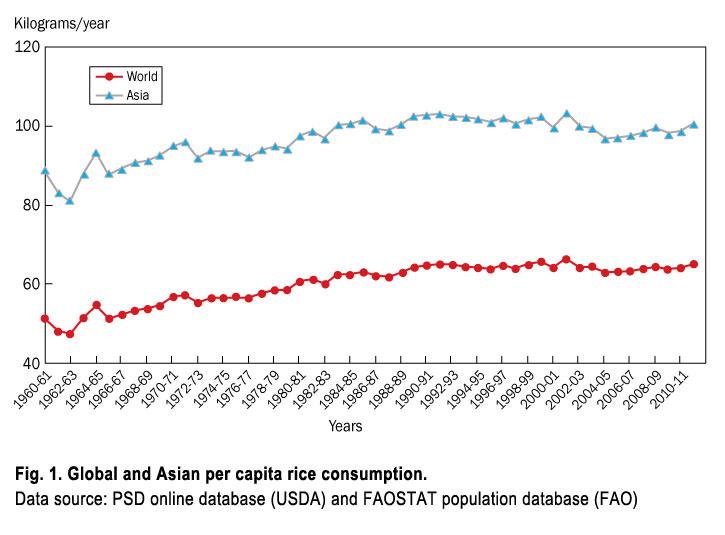
2. How much rice do you think you eat per year? Use measuring cups, electronic balances and rice samples to come up with an estimate. You may want different students/groups to describe their method of estimation. Calculate a class average and compare to global data.
3. Make a list of nutrients you expect to be present in rice and their functions.
4. Make a list of things you would not expect to be in your rice in significant quantities.
*You may make this into a competition and have groups compare their lists to the nutrition labels on several rice packages.
Introducing the Lesson:
Let students know that they are about to read a series of articles about an element that should not be present in significant quantities in rice, but is becoming problematic in one region.
Introducing Resource 1: "China’s Dirty Pollution Secret: The Boom Poisoned Soil and Crops"
Objective: Develop a broad understanding of the problem, identify the stakeholders, notice how the journalist engages the reader and develops their understanding throughout the article.
1. As you read this first article in a series about soil contamination in China, underline and annotate the article to focus on the most important aspects of the story. Then use the QAD to bring out the main ideas and details used to support those ideas. (QAD document at end of document)
2. Work in a small group (2-4 people) to first discuss and then complete the ‘further analysis’ section. Be prepared to share your responses with the entire class.
Introducing Resource 2: "In China's Heartland, a Toxic Trail Leads from Factories to Fields to Food"
Objective: Draw a diagram illustrating the flow of pollution from factories to consumers. Identify opportunities for intervention throughout the diagram.
1. Read the second article. Notice that it states that ‘Cao still does not understand exactly how the rice came to be contaminated with cadmium’. This second activity is designed to help him and others like him out.
2. In pairs, draw a diagram illustrating the origin(s) of cadmium, it’s flow through the environment, and exposure to humans. The diagram can either be intended for a technical audience or intended for the general public (this may depend on your art skills).
Diagrams should include the following items:
-
Non-ferrous metal mines→ wastewater → rice field irrigation
-
Non-ferrous metal mines→ wastewater → watershed contamination → rice field irrigation
-
Non –ferrous metal mines→ solid tailings→(escape to) soil contamination
-
Farmer→ national grain reserve (granary) → rice trader → mill/packager → consumer
3. Pass your diagram to another group, review their diagram and add opportunities for intervention in any place within your diagram that seems appropriate. Put a star next to any cleanup attempt that is referenced in the article- giving it a number on your diagram and the same number in the article. Add any additional ideas for clean-up or prevention to your diagram, but leave off the star.
Introducing Resource 3: "The Soil Pollution Crisis in China: A Cleanup Presents Daunting Challenge"
Objective: Identify considerations in cleaning up an incidence of soil/water contamination. Quantitatively describe an event or conflict.
When bad things happen, how do we let others know how bad they are? What kind of numbers might be helpful in really communicating the magnitude of this problem?
Discussion Questions:
- What evidence exists that contamination within the community occurred?
- Why is contamination still likely to happen even after the factory shuts down?
- What was the government’s response to the problem?
- How appropriate or successful was the government’s response to the contamination event?
- What options do villagers have?
- What does it mean for the site to be clean? Is it?
By the Numbers (worksheet attached)
1. Pick out 5 numbers reported within the story that you think best summarize the issue. Annotate the number with an explanation of what it represents.
Extension:
Option 1. Think carefully about how to present your numbers in terms of order, arrangement on a page, font size. Then turn your numbers and annotations into a full-page visual display. Inspiration) http://www.sewweekly.com/2012/01/the-sew-weekly-in-numbers/
Option 2. Try to summarize the article without using any numbers or data at all. You must attempt to convey the information contained within your 5 chosen quanities from the table without using any actual numbers. Read your article aloud to the class and compare it with the original.
Extension Activities:
I. Advanced Biology, Environmental Science, Biochemistry
Explore (Jigsaw): (worksheet attached)
Use the resources available at http://www.atsdr.cdc.gov/csem/csem.asp?csem=6&po=0 .
Students will investigate one subtopic relating to cadmium toxicity, taking their own notes. They will meet with experts from their own group the next day to clarify their own understanding of cadmium toxicity and then with students from other groups so that each topic is represented. Upon completion of information sharing, they will take the posttest provided by the CDC and/or discuss a medical case study.
II. Math, Environmental Science
1. Explain LD50.
https://www.youtube.com/watch?v=flKJ5Iqfl9Q
http://www.ccohs.ca/oshanswers/chemicals/ld50.html
2. If the acute lethal dose is 20-30 mg/kg of body weight (based on data from the UK Health Protection Agency), what would be a good estimate of a lethal dose for you based on your body weight? Show calculations.
3. Make a list of reasons your estimate might differ from the true value. Consider as many complicating factors as possible.
4. Lets apply this to the real situation:
- Why do you think it is so hard to determine a true lethal dosage to report to folks such as those in China regularly being exposed?
Further Resources:
Cadmium toxicity:
- The Agency for Toxic Substances and Disease Registry (ATSDR)
- The National Institute for Occupational Safety and Health (NIOSH)
- Public Health England
Cadmium in drinking water:
Name _____________________________________________ Period ________ Date ___________
QAD: "In China's Heartland, a Toxic Trail Leads from Factories to Fields to Food"
| Question | Answer (concise, main idea) | Detail (statistics or information from the article that support the answer) |
| What economic shift did China go through in the 1990s? | Industrialization | Factories built along lakeshores, new roads and highways, taller buildings, higher wages and prosperity |
| What problem are some rice farmers in China experiencing? | ||
| Why is rice contaminated? | ||
| What is the magnitute of the contamination? (How bad is it?) | ||
| What are the health consequences of rice contamination? | ||
| What are the environmental consequences of rice contamination? | ||
| What are the economic consequences of rice contamination? | ||
| What are some solutions being explored? |
Further Analysis:
1. How does the author engage the reader in this issue? Is their approach successful? Why or why not?
2. Rank the solutions being attempted from best to worst. Then explain why you are more impressed with some approaches than others.
3. Imagine the perspective of the various stakeholders involved in this issue. Choose 2 and write a quote you imagine they might give if you interviewed them about their thoughts on this article.
- Government (Ministry of Env Protection)
- Government (Ministry of Land)
- Farmers
- Public (rice consumers)
- Villager who had been employed at a small heavy-metal smelting factory
Names __________________________________________________________________________________________ Period __________ Date ________________________
How does rice become contaminated with cadmium?: "In China's Heartland, a Toxic Trail Leads from Factories to Fields to Food"
1. Read the article paying special attention to the flow of cadmium (Cd) through the environment. Underline and take notes where necessary. Then draw a diagram illustrating the origin(s) of Cd, it’s flow through the environment, and exposure to humans. The diagram can either be intended for a technical audience or intended for the general public.
2. Exchange diagrams with another group. Review their diagram and add opportunities for intervention (taking action to improve a situation) in any place within your diagram that seems appropriate. Put a star next to any cleanup attempt that is referenced in the article- giving it a number on your diagram and a corresponding # on your copy of the article. Add your own ideas for clean-up or prevention to your diagram, but leave off the star.
Name _________________________________________________________________ Period ________ Date __________________
By the numbers: How do we quantify problems and solutions?: The Soil Pollution Crisis in China: A Cleanup Presents Daunting Challenge
1. Pick out 5 numbers reported within the story that you think best summarize the issue. Circle them within your copy of the article, then write the notable numbers on the left side of the table below and annotate them with an explanation of what it represents.
2. (Extra Credit) Think carefully about how to present your numbers in terms of order, arrangement on a page, font size. Then turn your numbers and annotations into a full-page visual display like an infographic. Inspiration:
Quantity |
Reason that it is important |
|
5 |
This is the quantity of notable numbers you need to pull from the article to summarize the magnitude of cadmium contamination and clean up efforts. Be sure to include UNITS when appropriate. |
|
|
|
|
|
|
|
|
|
|
|
|
|
|
Name _______________________________________________ Period _____ Date __________
Homework (Jigsaw): Become a medical expert on cadmium toxicity.
You will become an expert on a particular aspect of cadmium toxicity using a course designed for primary care providers. Circle the topic that you are responsible for researching tonight. Then use the space below to take notes. You will meet with experts in other groups tomorrow to put your knowledge together. Use the given resources as starting points in your investigation.
All topics can be found in the green menu on the left-hand side of this page.
- Cadmium
- Where Found
- Exposure Pathways
- Safety Standards
- Who is at Risk
- Biological Fate
- Pathogenic Changes
- Acute Effects
- Chronic Effects
- Risk Factors
Notes:
This lesson contains notes for both students and the facilitator.