Why Visualize Climate Change?
“The ozone hole…moved the public because, though it was no more visible than global warming, people could be made to see it. They could watch it grow on video. Its metaphors were emotionally wrought:...[T]he hole evoked a violent rending of the firmament, inviting deathly radiation. Americans felt that their lives were in danger. An abstract, atmospheric problem had been reduced to the size of the human imagination. It had been made just small enough, and just large enough, to break through.” —“Losing Earth,” page 42
If people can see a problem, it is more likely to capture their attention and motivate them to act. These lesson ideas challenge students to create and evaluate visual representations of climate change to more effectively interpret and share some of the world’s most critical information.
Activity Ideas:
Digitally Illustrating Climate Change
Harness the power of social media to share images that matter! Using public domain images/artwork, students create a humorous or serious meme by illustrating a quote from “Losing Earth.” Students can share their creations on their personal accounts, or create a class Twitter, Instagram, Facebook, or blog to showcase all students' creations together. For instructions and examples, see the printable PDF attached below. For suggested quotes to get students started, see "'Losing Earth' Pull Quotes" below.
Put a Face on the Story: Making Modern Portraits
“Losing Earth” introduces a large cast of characters who shape the course of climate change history, for better and for worse. Students should select one person featured in the story and collect at least three quotes from them and/or descriptions of them in the story. They should use these to guide them in creating a portrait of that person. The quotes can either be incorporated into the portrait, or used to caption it. For this activity, “portrait” is defined in broad terms as a creative representation of the individual; students' images need not be literal depictions of their subjects, nor necessisarily feature a person at all. For more on modern portraiture, see the MoMA definition.
One Story, Many Angles: Comparing and Contrasting Images of Climate Change
Journalists’ choice of images to include in their reporting can have as much of an impact as the facts they include. Moreover, depending on the lighting, camera angles, colors, centering, and other techniques the photographer employs, images can give rise to starkly contrasting ideas and emotions.
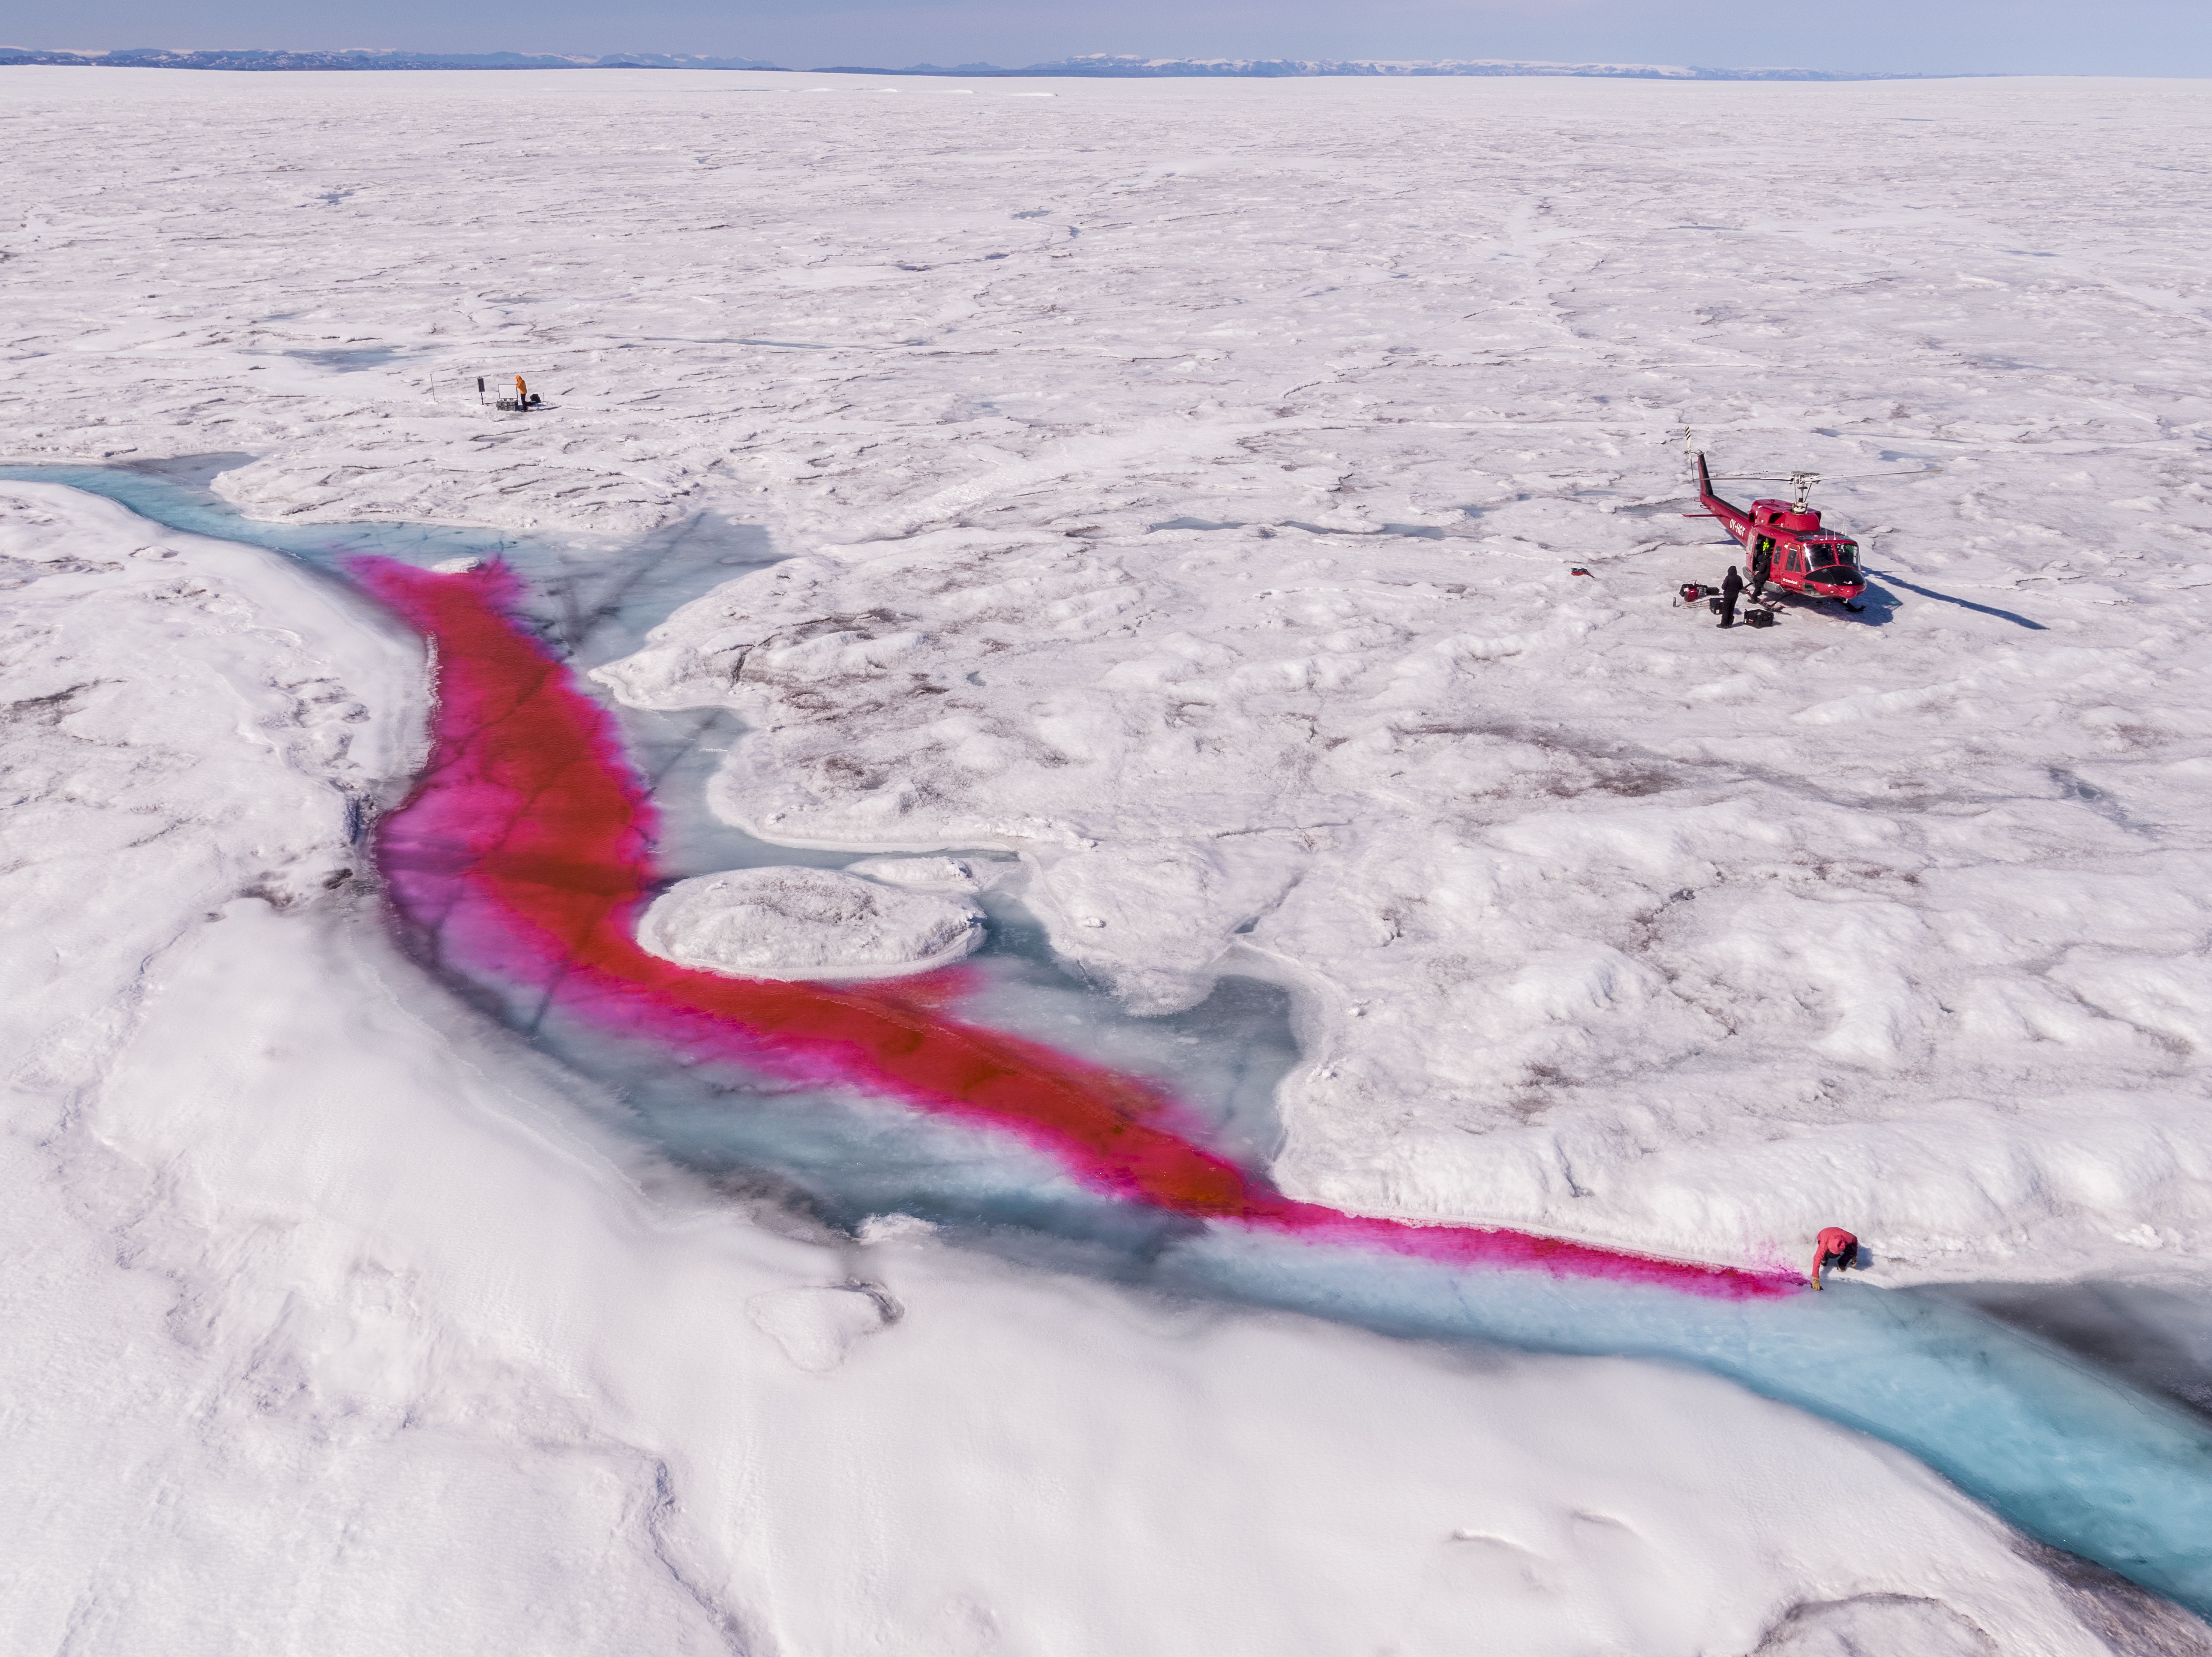
The attached PDF below contains photos, captions, and instructions for a short visual literacy and writing activity that asks students to compare and contrast photos of climate change by two photographers: George Steinmetz for "Losing Earth" and Larry C. Price’s “Deadly Pollution: The World’s Most Toxic Places.”
"Losing Earth," the Graphic Novel
Illustrations do more than decorate the page; they can tell a story in their own right. This activity rallies the whole class together to create one original graphic novel while also allowing students to express their individual points of view, showcasing their skills in making inferences, summarizing, and visualizing a story.
“Losing Earth” is divided into 19 sections (8 in Part One and 11 in Part Two). Assign one or more parts to each individual or small group. Their task will be to tell the story of their section(s) in graphic panels (printable templates here). Students can illustrate using any media or stylization, but should be sure to select only the most important quotes/dialogue to include rather than reproducing the entire text; their illustrations can do the rest of the work!
The activities listed above are designed to build on students' exploration of The New York Time Magazine's "Losing Earth," which was written by Nathaniel Rich and includes photography from George Steinmetz. For support facilitating the exercises above, or with connecting a journalist to your classroom, email [email protected] to connect with a member of our staff.
You can find more related educational resources at www.pulitzercenter.org/nytclimate.
